
Designing Your Energy Lifestyle: Data Thinking – Data Visualization
Background
Increasingly educators are acknowledging the importance of engaging youth in data science and data
thinking. This includes conveying information on what is data, examination of types of data such as time
series data, how to visualize data, and use of tools for data analysis and visualization – as a way to
prepare youth for success in an increasingly data-driven world. At the same time, research has
demonstrated that youth have agency within their families and can lead and support family efforts to
reduce energy and advance environmental actions.iii Combining these concepts, we introduce the
Designing Your Energy Lifestyle: Data Thinking – Data Visualizationiv workshop series, a Science,
Technology, Engineering, Arts and Humanities, and Math (STEAM) focused,v behavior change theory
driven, research-based program for middle and early high school aged youthvi that aims to increase
energy data literacy while building knowledge and promoting household energy savings.
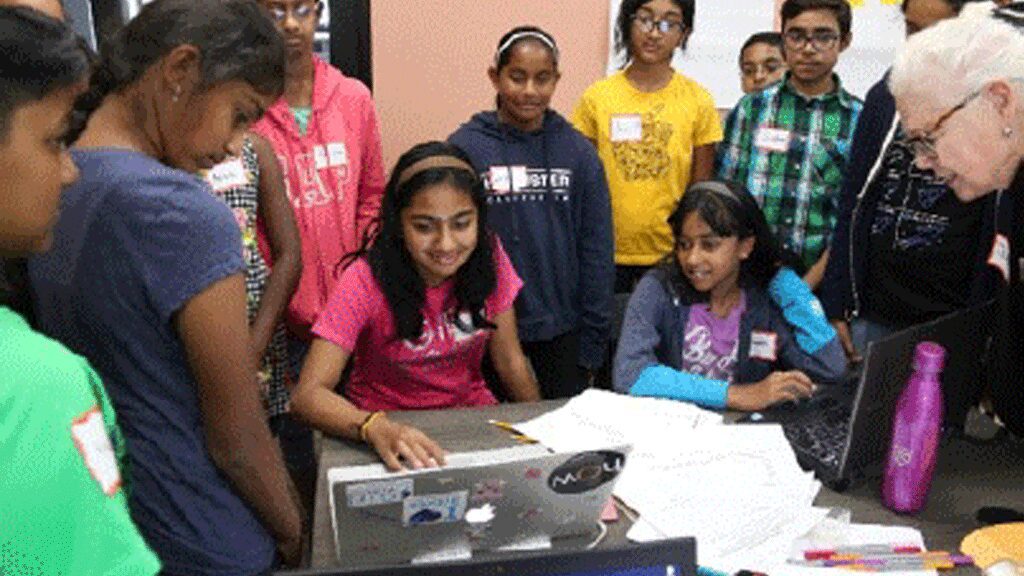
vii Through a series of three, three-hour workshops, middle and high school students learned about energy data and
data visualization, practiced creating personal household visualizations, created a story around those
visualizations, and presented a portfolio of these visualizations in the context of a household energy
conservation management story (Figure 1 – Participants examining each other’s visualizations).